
Once an agent is in production, knowledge about what the agent actually does wrong gets scattered across various places: a customer complaint that happens to reach the right channel, a Slack message from the deployment strategy team, an engineer who happened to scroll past something odd in a trace. Here at Conversion, we fixed what came through these channels. But that means relying on a human noticing a problem and deciding it was worth reporting.
To make this scalable and more systematic, we wanted a data flywheel: a system that allows us to continually improve the agent harness from what production actually shows without waiting for a human to notice something. Ideally, the telemetry flags problems and proposes solutions on its own, we fix them, and the telemetry then tells us whether the fix held.
So we built Periscope, an internal AI observability platform that analyzes incoming traces to answer two questions:
- What keeps going wrong?
- What kinds of work do people actually give to the agent?
The first question provides a ranked and evidenced list of issues to fix. The second tells us where to invest our engineering effort to improve the agent’s performance on the most important tasks.
Reading traces at corpus scale
The insight we wanted was never in any single trace. Whether a tool is confusing, whether a workflow reliably fails, whether the agent has secretly invented a workaround: these are properties of a corpus. Patterns like these only arise when looking at the entirety of the data. Unfortunately, a corpus of agent traces is far too large for anyone to read end to end - and more importantly, traces may contain sensitive customer data that we must avoid retaining.
Therefore, the first stage of the pipeline is an analyzer agent that reads one conversation and writes down what happened. It anonymizes identifying details and compacts a conversation to the key events that occurred: which tools were called, what errors came back, how many times the agent retried. Everything downstream reads what the analyzer wrote rather than the trace itself, which is what lets the rest of the pipeline store, query, and cluster freely & efficiently.
To keep the analysis as accurate as possible, findings must cite specifics, meaning turns, tool names, error strings, and counts - “the agent seemed confused” is not something anyone can act on. And the analyzer is allowed to find nothing at all, which is the correct output most of the time. An analyzer that must produce a finding on every conversation will produce mostly fiction.
Episodes: choosing a unit
Our next step was to sort these conversations into buckets of similar tasks - CRM Hygiene, Asset Generation, etc. But conversations can be long, and users do several unrelated things in one session; importing a CSV, then asking why a workflow didn’t fire, then building an audience. Few conversations can actually be attributed to a single topic - most are a combination of many. Therefore, for any of the downstream analysis to be measurable, we needed a more granular unit of work that can succeed or fail.
The unit we settled on is the episode: one thing the user was trying to get done, however many turns it took. Segmenting conversations into episodes is the analyzer’s other job, and each episode gets an outcome: resolved, partial, failed, or unclear. Outcomes at this granularity are what make the later analysis trustworthy; a failure rate per conversation would mostly measure how many things people attempt per sitting.
Topic analysis
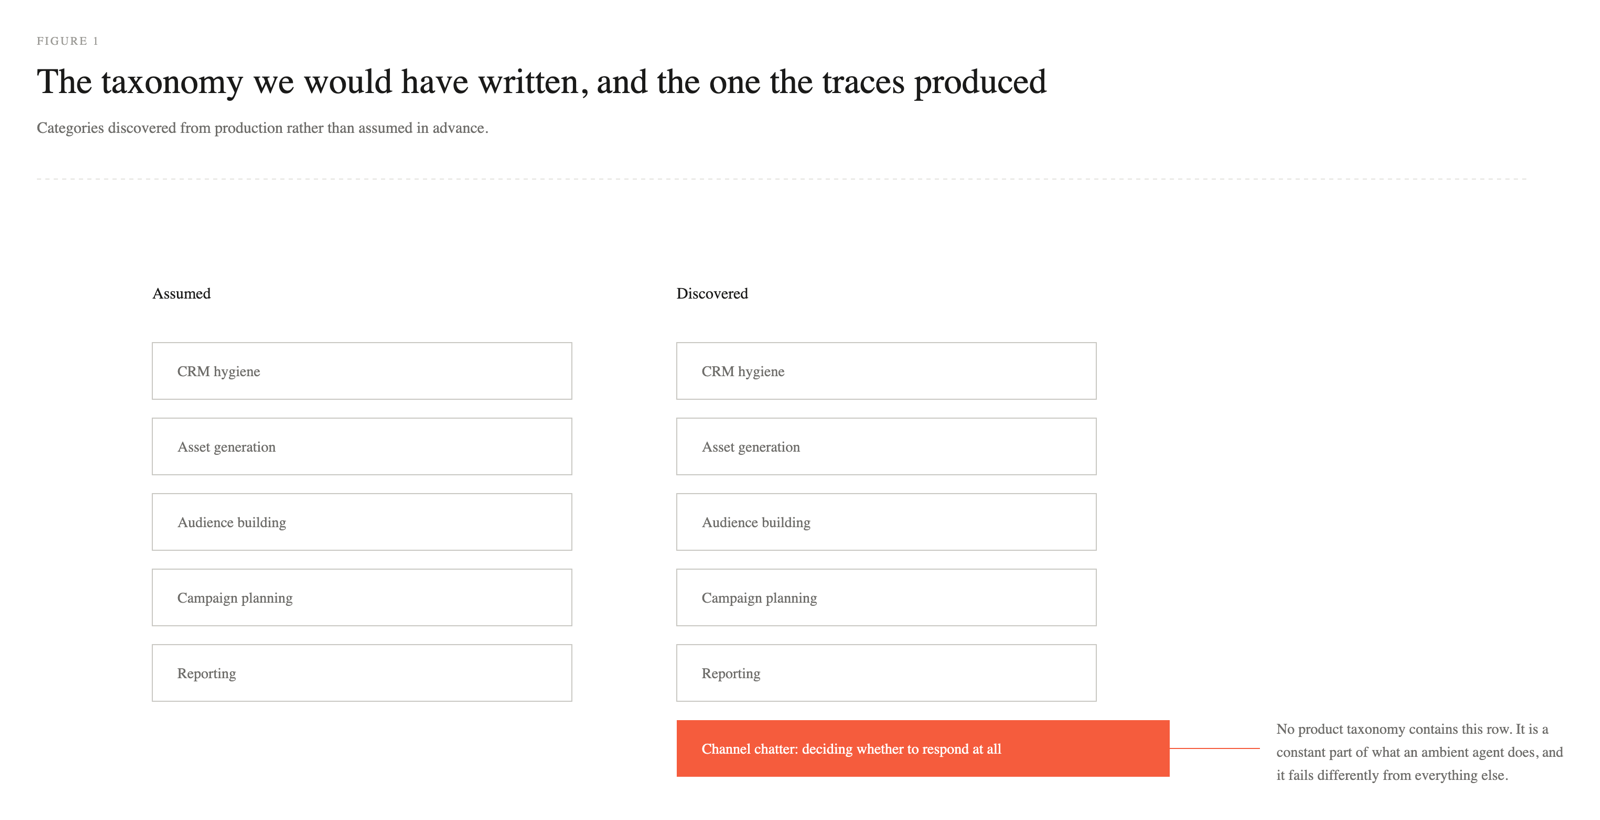
The obvious way to get a map of usage is to write down ten categories we believe cover the product, then classify each episode into one of them. The problem is that this assumes the answer to the question we’re asking. A list we write ourselves encodes what we think people use the agent for, every episode gets forced into the nearest of our guesses, and a use case we never imagined has no bucket to show up in.
So we inverted it and let the taxonomy come from the traces. The gap between the list we would have written and the list the pipeline produced showed up in the categories that aren’t really “work” at all. The clearest was a topic for messages where the agent’s entire job is deciding whether to respond in a Slack channel it’s a part of: channel chatter, file drops, greetings, content-free pings. No product taxonomy would contain that row, but it’s a real and constant part of what an ambient agent does, and it fails differently from everything else.
Discovering topics runs as two passes. First, proposer sub-agents each read a batch of episodes in parallel and suggest categories for the work they can see. Then a single coalescing pass reads every proposal, merges the near-duplicates, and produces one candidate taxonomy, which a person reviews and publishes. After publishing, an assignment pass files each episode under a topic from the final list. Episodes that fit nothing are kept visible as misfits rather than forced into the nearest category, and a growing pile of misfits is usually the first sign of a new use case.
The taxonomy is versioned. When usage shifts enough that the map no longer fits, we regenerate it and reclassify, and old episodes carry forward.
Failure mode analysis
For a self-improving loop to be trustworthy, the failures it acts on have to be real. An automated system that generates plausible-sounding problems is worse than no system, because every fictional finding spends engineering time and erodes the trust that makes anyone read the next report. So the failure side of the pipeline is built around one requirement: a failure mode has to be recurring, evidenced, and checkable before it earns a place on the list.
Recurrence is the bar for existing at all. The analyzer’s observations are single sightings, and a single sighting is an anecdote; the pipeline only names a failure mode when the same mechanism shows up across multiple independent episodes. Structurally this works like topic discovery: sub-agents read batches of observations in parallel and propose patterns, a condensing pass merges every proposal into a canonical set of named modes, and an attachment pass re-reads the unclaimed observations against the final list. Different sub-agents proposing the same pattern from different batchesis the recurrence signal we are looking for.
Every named mode then has to survive a human reading it, so it carries its evidence with it: the observations behind it and the episodes they came from, which a reviewing engineer can open and judge for themselves. Each mode also comes with a proposed fix to the harness, grounded in what actually went wrong in those episodes. Their value is that evidence and a concrete suggestion sitting side by side let an engineer tell quickly whether a mode is a quick win, a real project, or a misread.
What it surfaced
The most frequent failure mode in the corpus was the code sandbox missing tools and libraries the agent reaches for first: jq, a working pip, pandas. Its first attempt at parsing a large payload or reading a spreadsheet would fail, and it would spend a few extra calls rewriting the same logic from scratch. The agent recovered almost every time, so nobody ever reported it; in any single trace it read as a minor stumble, and only the corpus view showed how often it was happening. The fix was installing the packages, with the corpus doubling as a ranked list of which ones the agent actually wanted.
The second was the agent answering aggregate questions by looping over single-asset tools: average performance across a set of emails meant calling the per-email metrics tool once per email and totaling the results in the sandbox. Nothing failed and nobody complained; it was just slow and wasteful every time. The corpus showed the workaround happening constantly, so we shipped batched metrics tools, which we wouldn’t have known to prioritize otherwise.
Closing the loop
A ranked list of problems only becomes a flywheel if it lives where engineers already work, so Periscope also speaks MCP. From inside a coding agent, an engineer can list the open failure modes, pull the evidence episodes for one, and go make the change without leaving the editor. The other half of the loop is our observability tool depicting clear drops in failure mode telemetry. The sandbox and batch-metrics fixes are the first ones through this gate, and their sighting rates falling is what tells us the loop runs end to end, from production behavior to measured result.
What’s Next
All of this investment in telemetry points at one destination: benchmarks built from reality. The topic map tells us what people actually use the agent for and in what proportion, and the failure modes tell us where the work is hard, which is exactly where a benchmark should concentrate. Together they let us curate eval tasks from real marketer workflows rather than inventing them, and hill-climb on the work our customers actually bring us. We strongly believe that the best marketing agent will be built by whoever has the tightest loop between what their customers actually do and the harness that serves them. How we build those benchmarks gets its own post.
If building self-improving AI systems like this one excites you, we’d love to work with you! We’re hiring: conversion.ai/careers.